
Things to be covered in two days...
D3.js & It's basics
DATA, and the need to visualize it
Supported data formats
Supported Technologies
SVG, its PROS and CONS
D3js Access Method
D3 Scales
D3 Axes
D3 transitions
What next?
D3.js
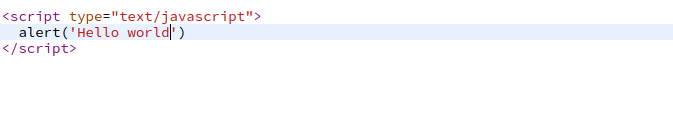
- It is a Javascript Visualization Framework
- It Deals with Data Driven Documents
- Today, we Will be dealing with version 3.5
- D3.js is an open source library and hosted over github
Visualization Process
What is Data ?
Data is a digital representation of real time information
- can be a,
- -social media data
- -bank account data
- -stock market data
- Its almost EVERYWHERE! Thus,we cannot ignore data. Couple of reasons being,
It has a capability to show the past, draw the present and design the future
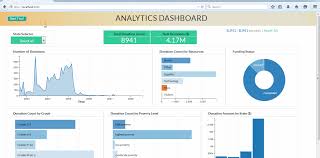
Why should we VISUALIZE data?
Raw data does not make much sense to we, humans
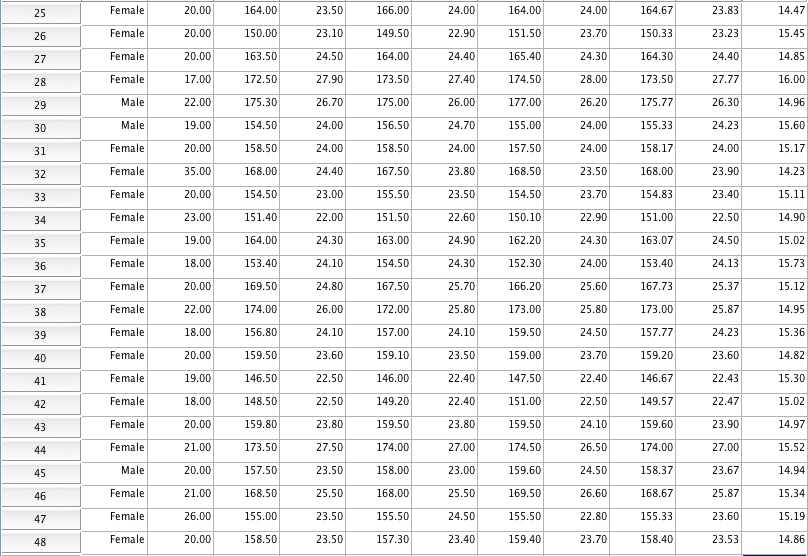
But
Visuals do make some sense
Supported data formats
Array of numbers
[1, 2, 3, 4, 5, 6]
Array of array of numbers
[[1, 2, 3, 4, 5, 6],
[1, 2, 3, 4, 5, 6],
[1, 2, 3, 4, 5, 6],
[1, 2, 3, 4, 5, 6]]
Array of javascript objects
[{'name': 'mukul', 'name': 'vijay', 'name': 'rahul'}]
csv format of data
1,2
3,4
5,6
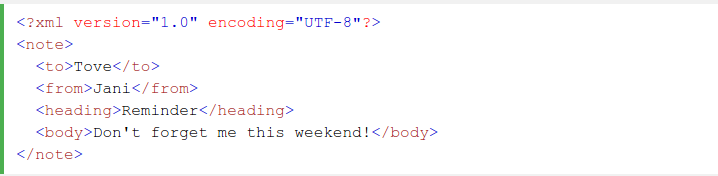
JSON format of data
{'name': 'mukul', 'name': 'vijay', 'name': 'rahul'}
Technologies which can help
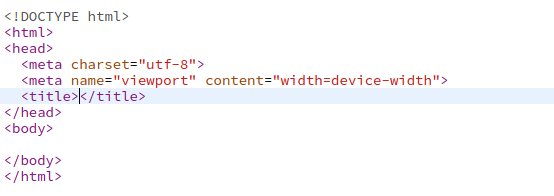
HTML
Hyper Text MarkUp Language
Browser Language to read web pages
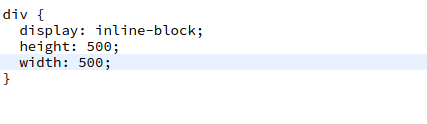
CSS
Cascading Style Sheet
styling language to style dom elements
JQuery
A Javascript Framework
Makes life easier while dealing with Browser
Before D3, lets have to a look at..
- Jquery helps to understand very basic concepts which have been used in D3.
- However, there is no relation between Jquery and D3 but D3 also uses DOM SELECTER API which also used by Jquery and It is easy to understand with the help of Jquery.
Jquery Examples
Jquery Selectors
Jquery Method Chaining
Jquery Effects
Types of visuals
Raster Images (jpeg/ png/ gif)
Use pixels to create graphics
SVG
Use vector theory to create graphics
svg
Scalable Vector Graphics
svg creates graphics using vector theory.
It uses xml format to store/ access images in browser memory.
XML is extended mark up langauge and a sister language of html.
Pros
It gives better performance in terms of zoom level because it does mathematical computation while reducing/ increasing size of images.
XML is portable across different browsers.
D3.js uses svgs to create graphics on the browser screen.
Cons
Hard to make complex images in svg
Image compressions and other optimized technologies are not useful for svgs
SVG Shapes
- rect
- line
- circle
- ellipse
- polyline
- ploygon
- path
- point
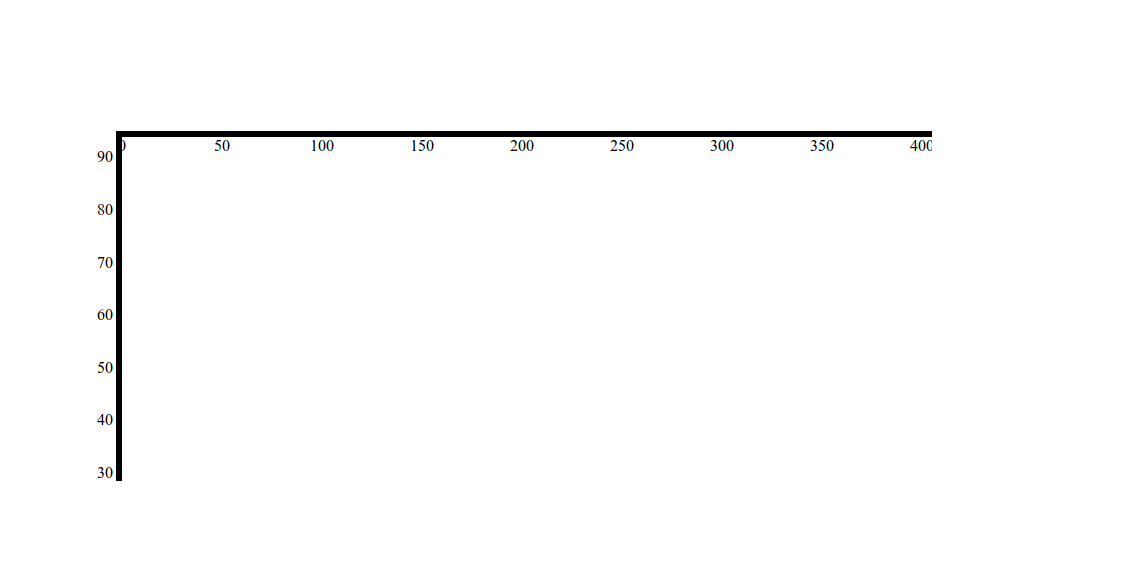
SVG Axes
rect

- x - distance from x axis
- y - distance from y axis
- width - width of rectangle
- stroke - styles for rect's border
- style - css style for rectangle
circle

- cx - distance from x axis to its center
- cy - distance from y axis to its center
- r - radius of circle
- stroke - styles for rect's border
- style - css style for rectangle
ellipse

- cx - distance from x axis to its center
- cy - distance from y axis to its center
- rx - radius of circle for x axis
- rx - radius of circle for y axis
- stroke - styles for rect's border
- style - css style for rectangle
line

- x1 - point where to start at x axis
- y1 - point where to start at y axis
- x2 - point where to end at x axis
- y2 - point where to end at y axis
- stroke - css style for rectangle
path

attribute d="M50, 50 A30, 30 0 0 1 100, 100"
- M to move to 50, 50 units over svg axis
- A to make an arc with radius 30, 30
- 0/1 to rotation about x axis
- 0/1 to make large arcs
- 0/1 to create mirror arcs
- 100 100 end points for arc
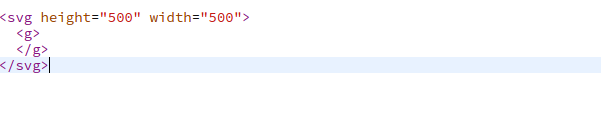
svg - g

It is used to group elements to perform multiple operations over multiple elements at once.
SVG Example
Lets try some basic shapes with some examples
SVG Shapes Resource
I would like to recommend this SVG Resource , any one can refer this to read more about SVG
D3 Version of SVG Example
Lets embed basic d3 into previous examples.
- SVG Boy
- Practise - Harry Potter Pendant
D3 methods used in examples
- select - used to select a single selector element
- selectAll - used to select all the selector elements
- append - used to append an element under defined selector element
- attr - sets attributes for selectors
- Many more ...
D3 Selections: How it works
D3 Selections: How it works
Hurray! We wrapped the forst part!
How are you feeling ?


Let's start second part !!!
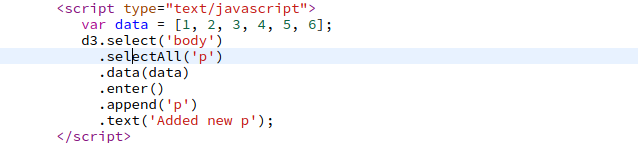
Let's attach some data to dom elements now
Let's take an array and attach its elements with DOM
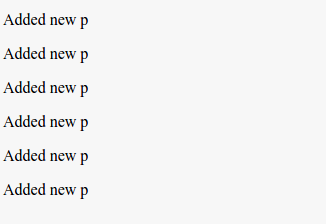
Where is the data ?

enter / update / exit
Access methods to deal with DOM elements
D3 calls them joins as they join data with DOM elements
Very important as they provide generalisation to CURD operations
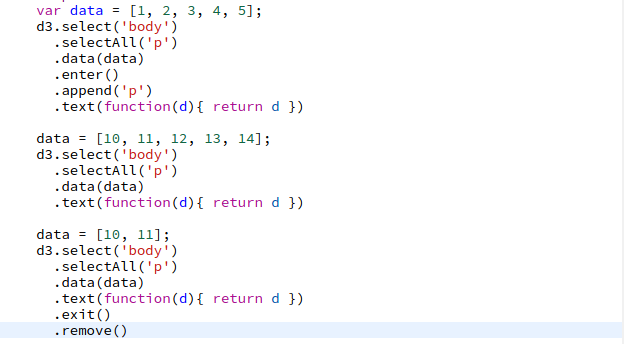
Enter Method
Enter Method
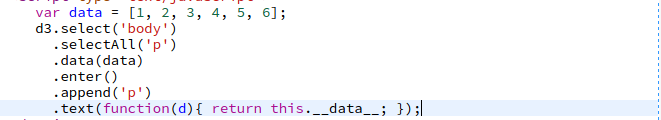
Update Method
Update Method
Exit Method
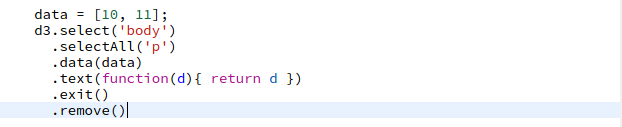
Exit Method
Lets take a combined look of all 3 access methods
Can you try this example ?
Access Methods
Lets get our hands dirty now
Lets create a bar chart
Done for the day..Relax now!!!
How are you feeling ?
Lets do our hands dirty now
Now Lets try for a horizontal bar chart
Now Lets try for a scatter plot
D3 Scales
Method to compress actual data values
Domain takes data values
Ranges convert domain values into given ranges
Does not create any visual components but helps them to be fit into given space
Mostly used D3 Scales
Linear Scales, converts domain values in continous ranges
Ordianl Scales, converts domain values in discreate ranges